
 SMRTILYTICS is a bit of a hobby of mine. For a full explanation of this project, check out the main SMRTILYTICS page. -OG
Week 6
Welcome back to another year of SMRTILYTICS!
SMRTILYTICS is a bit of a pet project of mine here on SMRTETA.com. It looks at a couple team statistics produced throughout the season and asks what conclusions (if any) can be derived from those stats.
Last year, it turned out to be a very enjoyable distraction and I’ve decided to bring it back for another crack. It may change a bit as we go this season as I apply more theories for testing but in a nutshell, here’s how it works.
First off – I’m not a statistician. I’m fairly certain what I do here would seriously offend actual statisticians which I would find tremendously entertaining. Additionally, I’d strongly recommend you read this as a bit of fun and not for betting tips. In fact, don’t bet any money on anything I tell you in this column – that’d probably be for the best.
Right, now that we’ve covered that bit – what exactly is it?
Well, the long and the short of it is that I review certain statistics from EVERY Premier League game, record them, plug them into a big excel spreadsheet, perform some absolutely basic calculations, and then share them with you along with some theories/analysis.
The statistics I capture are points, goals scored, goals conceded, shots for, shots against, shots for on target, and shots against on target – all of these are provided by OPTA as the database of record. While I’m aware of current popular statistics like Expected Goals and Packing, I’m completely zeroed in on two very specific stats: Total Shot Ratio on Target (TSR*) and Goals Conceded.
Here’s a brief explanation of those and why I like them.
Total Shot Ratio on Target (TSR*):
Total Shot Ratio is used in sports like ice hockey and is a reflection of the total shots taken versus those conceded. There tends to be a lot more shots in hockey but I’m still interested in how it can be used as a predictor for football. More specifically, I’m interested in Shots on Target as there is an implied level of quality to on target shots versus all shots.
The way to calculate TSR* is by adding the shots on target for to the shots on target conceded as a total shot tally and then dividing the total shots for by that tally. Here’s an example:
Team A has 6 shots on target and allows 4 shots on its own goal by Team B. The total amount of shots is 10 (6+4). Team A’s TSR* is 0.60 and Team B’s is 0.40.
Last year, the highest TSR* in the League belonged to Tottenham at 0.67 (Arsenal was 0.58).
Goals Conceded:
This one is very straight forward and is based on an observation made some time ago that while teams winning the League had a significant variance in goals scored down the years, the variance in goals conceded was much, much smaller. Since the 1990/91 season, the average goals conceded needed to win the League is 32.31 goals. Averaged across the 38 League games in a season, and that is 0.85 per game.
I like to watch this one as it gives a pretty good indicator in terms of placement on the table. When you view the Big Chart during each update, check out how Arsenal are doing against the historical averages for Goals Conceded and Scored in the top right of the graphic.
Combined Metric:
One thing I did do last season was invent a way to combine the TSR* and Goals Conceded stats into a combined metric. You can read more about the formula here.
There are a couple key items to note:
- The two metrics are weighted evenly. I’ve debated relooking at that but for now it is as is.
- The lower the metric the better. Tottenham had the best at 0.30 last term whereas relegation teams were at a 1 or higher.
Along with all of this, the Big Chart – which is the big picture linked below, has other useful information crammed into it for your personal enjoyment.
Starting Week 10, I will begin predicting League finish for the Top 4 and Bottom 3. If you’re curious as to how I did last year, check out my 2015/16 Year End finale extravaganza here. I find it is pretty fun to do that as we go and see how teams’ fortunes change throughout the season based on fixtures, transfers, injuries and even changes in management.
For a bit more on the history on SMRTILYTICS, see my general information page here.
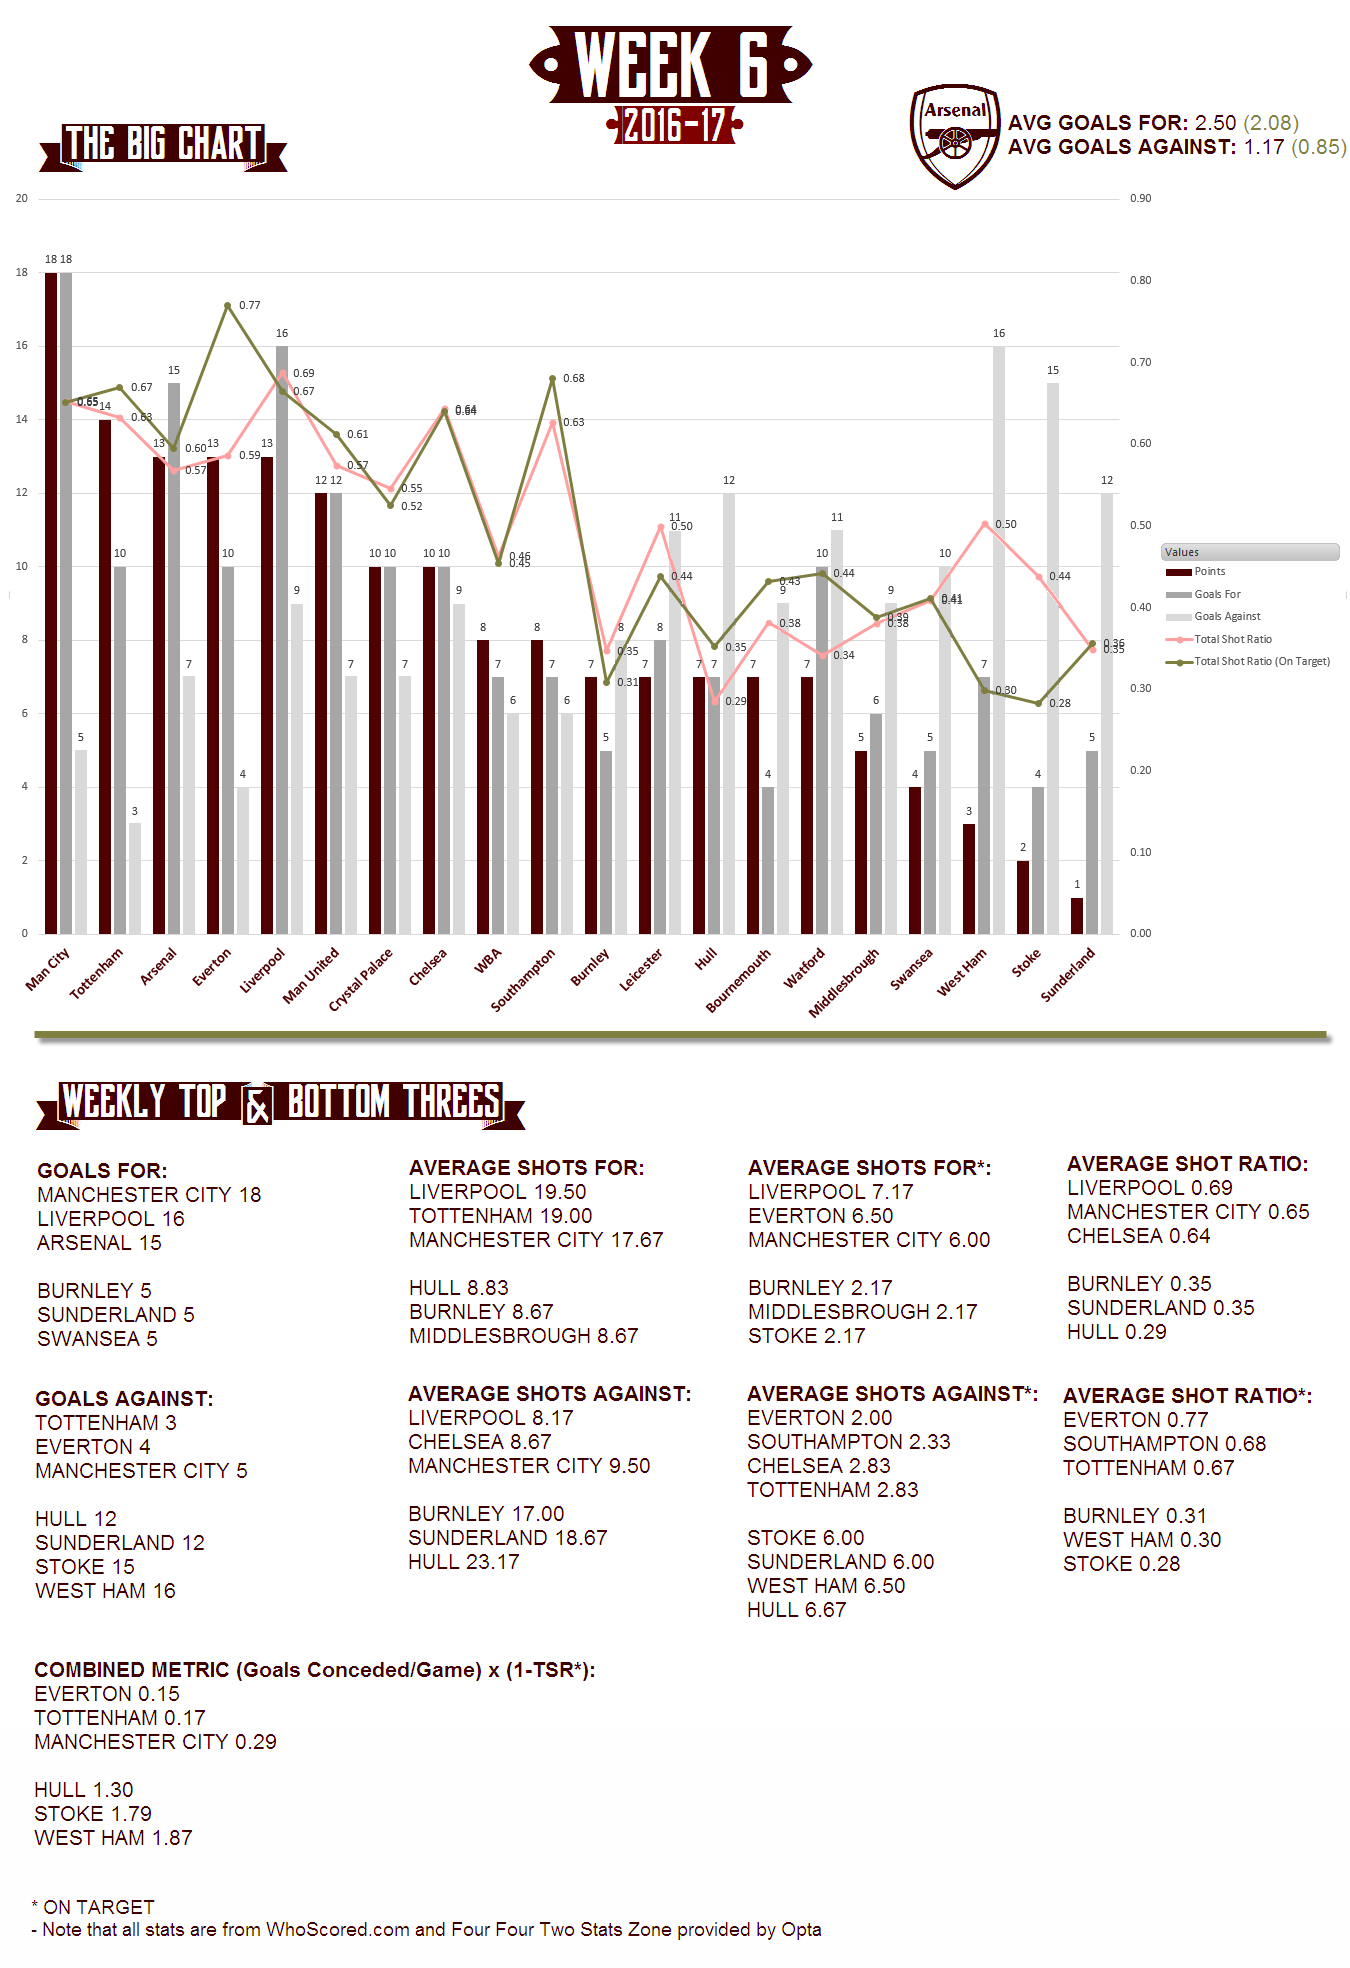
Click this graphic to see it in full resolution
So, how are we looking after 6 rounds of the Premier League ?
It’d be only right to look at the only team to not drop points to date, Manchester City, first. City are looking very strong at the moment at the summit of the table with a perfect 18 points, 5 goals conceded (avg. 0.833), a TSR* of 0.65 and a combined metric of 0.29.
There’s a couple things to note here of interest – firstly that City do not lead the League in Goals Conceded (Tottenham 3), TSR* (Everton 0.77), or Combined Metric (Everton 0.15). Secondly, they did this last year through the first six games and looked poised to destroy all comers (you can take a look at Week 6 from last season here if you’re interested). In fact, their first six games last season saw them have a League leading 0.83 TSR* and 2 goals conceded. I understand that those are apples and oranges as the opponents have changed, but I do think it is worth pointing out. We’ll see if City have the staying power to keep winning.
Speaking of Everton, their stats are pretty amazing. Currently in fourth, they boast a League best TSR* and Combined Metric (as noted above). They also have only conceded 4 goals. It’s still too early to say how this will play out for them but it does seem like Koeman is doing some things right at Goodison Park.
At the foot of the table, we have teams like Stoke and Sunderland along with a bit of a surprise in West Ham. The Hammers boast the worst record for goals conceded at 16, the second worst TSR* at 0.30, and the worst Combined Metric at 1.87. Those numbers have relegation written all over them and are far worse than Villa’s numbers for the same period last season.
Finally, looking at Arsenal this week, our numbers have not been that great but by no means awful either. This is down to both that disastrous opener versus Liverpool and our pesky habit of conceding goals, even when we win. Right now we have conceded 7 goals (or avg. of 1.17) which is good for joint 6th in the League. Our TSR* is 0.60 and our Combined Metric is 0.47. All of those numbers are manageable based on what we saw last year, but they aren’t in the top four for any specific stat. The encouraging bit is that it took most of the season last year for Leicester’s stats to correct themselves to match their eventual League finish.
Additionally, Arsenal have a pretty good run of games over the next little bit so I’ll be hoping for wins and clean sheets.
I think that’s it for now, hopefully you’ve enjoyed. The next update should be around Week 10 as I’m off to London for a bit of a vacation for weeks 8 and 9.
Youknowit.
OG
PS – Shout out to Mitch the Gooner (@everyonetalks21). Go give him a follow!